Chỉnh màu graph giống với màu Cell

Liên hệ QC

hadoan-pap

Thành viên tiêu biểu
Tham gia
8/7/15
Bài viết
453
Được thích
18
Em chào mọi người!

Em có chút issue nhưng tìm chưa thấy cách để làm được ạ.

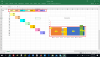
E có file như đính kèm, em muốn tạo chart nhưng trong chart thì nó phải khớp màu với màu của Cell theo từng item như ảnh bên dưới.

Rất mong mọi người hỗ trợ cho e xin đoạn code.

Em xin cảm ơn!
 

File đính kèm

  • 1.png
    1.png
    182.8 KB · Đọc: 9
  • File.xlsm
    59.7 KB · Đọc: 7
Chào mọi người!

Có ai biết về tùy chọn này có thể hỗ trợ em được không ạ ?
 
Upvote 0
Chào mọi người.

Em mới tìm được đoạn code xử lý được việc này rồi ạ.

Dim oChart As ChartObject
Dim MySeries As Series

For Each oChart In ActiveSheet.ChartObjects

For Each MySeries In oChart.Chart.SeriesCollection

Dim sFormula As String
sFormula = Split(MySeries.Formula, ",")(0) 'this returns the =SERIES(Sheet!RC part of the formula, the first argument is the series label
sFormula = Split(sFormula, "(")(1) 'this removes the =SERIES( leaving only the column label range (Sheet!RC)

Dim lSourceColor As Long
lSourceColor = Range(sFormula).Interior.Color

With MySeries
.Interior.Color = lSourceColor
.Border.Color = lSourceColor
'.MarkerBackgroundColorIndex = lSourceColor
'.MarkerForegroundColorIndex = lSourceColor
''.MarkerBackgroundColor = lSourceColor
''.MarkerForegroundColor = lSourceColor
With .Format.Line
.ForeColor.RGB = lSourceColor
.BackColor.RGB = lSourceColor
End With
.Format.Fill.ForeColor.RGB = lSourceColor
End With

Next

Next
 
Upvote 0
Web KT
Back
Top Bottom