quynhloan_uit
Thành viên mới

- Tham gia
- 14/12/10
- Bài viết
- 3
- Được thích
- 0
Em có 1 file excel bên dưới có sử dụng một số công thức dùn để vẽ biểu đồ nhưng mình không hiểu rõ ý nghĩa của nó. Các bác chỉ cho em với ạ.
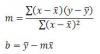
Trong sheet PB Burndow có chart
-Velocity and Remaining Work có đường Trend màu tím công thức vẽ là : SERIES("Trend",,ph_product_sprint_backlog_0.03.xls!PBTrend,5)
-Development Velocity có 3 đường màu đỏ, xanh lá cây, xanh da trời với công thức tương ứng lần lượt là :
Đỏ : SERIES("Average Realized",,ph_product_sprint_backlog_0.03.xls!AverageSpeedRealized,3)
Xanh lá cây: =SERIES("Avg. Last 8",,ph_product_sprint_backlog_0.03.xls!AverageSpeedLastEight,4)
Xanh da trời: =SERIES("Avg. Worst 3 in Last 8",,ph_product_sprint_backlog_0.03.xls!AverageSpeedWorstThree,5)
Trong sheet Sp1 có chart Working Remaining có đường Ideal progress và Current trent với công thức tương ứng lần lượt là:
Ideal progress: =SERIES("Ideal Progress",,Sp1!$F$11:$AD$11,2)
Current trent: =SERIES("Current Trend",,Sp1!$F$12:$AD$12,3)
 . Em đọc mà không hiểu ý nghĩa của công thức này là gì. Hic, bác giúp em với