Cho mình hỏi về biểu đồ Box and Wiskerplot (2 người xem)

  • Thread starter Thread starter luanvn
  • Ngày gửi Ngày gửi
Liên hệ QC

Người dùng đang xem chủ đề này

luanvn

Thành viên mới
Tham gia
9/11/09
Bài viết
3
Được thích
0
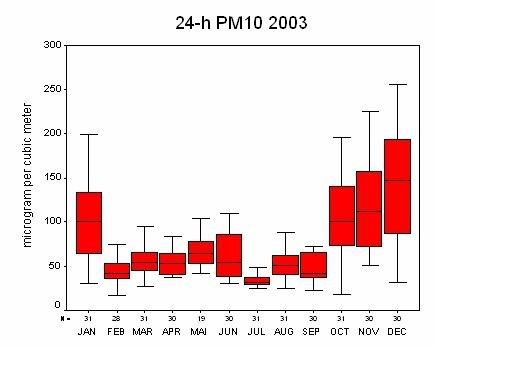
Monthly variations of SO2 and PM10 concentrations at Lang meteo garden displayed as box-whiskers. Horizontal bars inside the boxes represent monthly mean concentrations. Top and bottom bars of the boxes are 75 and 25 percentiles, the whiskers represent 5 and 95 percentiles
bieudo.jpg

Cho mình hỏi loại biểu đồ này thì vẽ thế nào?
 
Còn loại biểu đồ này
Có bạn nào biết cách vẽ thì chỉ giúp mình
hinh1.jpg
 
hinh1.jpg


Changes of wind speed and wind direction (red bar) during a NRI pollution episode in October 2003. The prevailing wind direction is north northeasterly. Hourly values of PM10 concentrations in mg m-3 are plotted in the top
 
Web KT

Bài viết mới nhất

Back
Top Bottom